Recursos (also Información del Sistema) shows the technical status of the server where PetSoph runs: CPU, memory, disk and swap usage. It is a read-only screen, not a configuration one.
How to get there
- Sign in to PetSoph.
- Side menu Administración → Recursos.
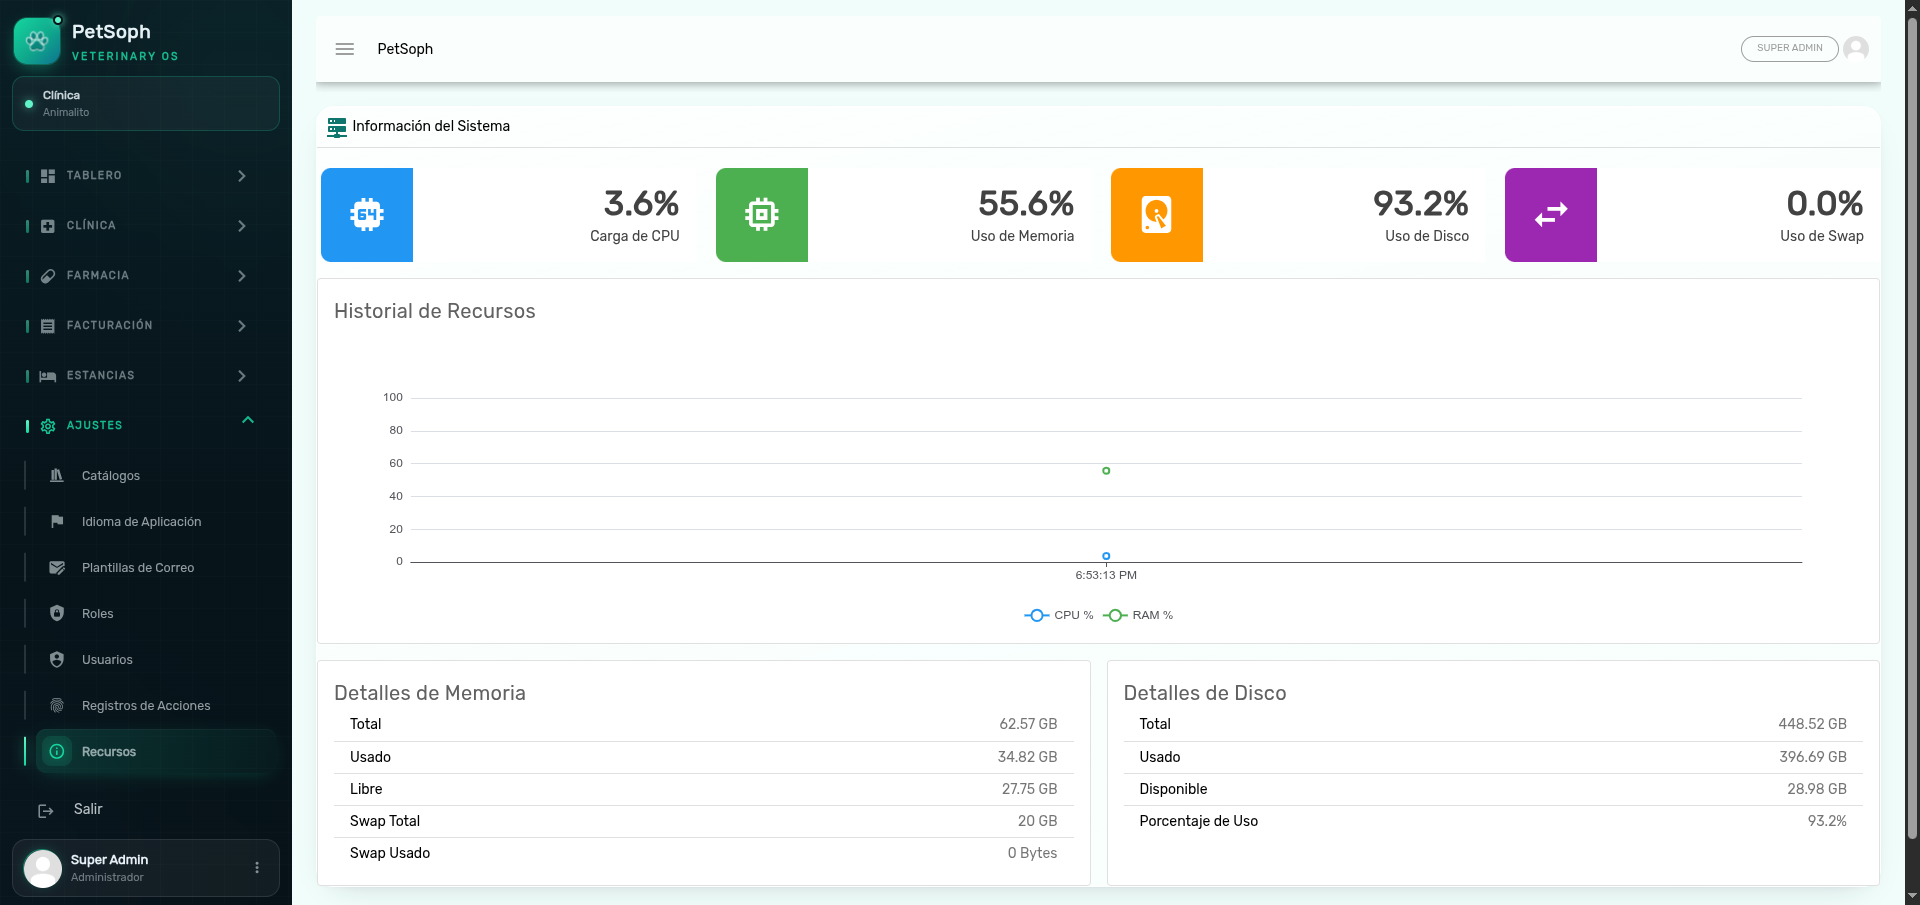 Figure 1. Real-time metrics for CPU, memory, storage, and infrastructure status.
The four indicators
| Card | What it shows |
|---|---|
| CPU load | Current processor usage in percentage |
| Memory usage | Used RAM in percentage |
| Disk usage | Storage occupation in percentage |
| Swap usage | Swap memory in percentage (or N/A if there is none) |
History chart
Below the cards, a chart draws the CPU and RAM evolution over time. It refreshes every 5 seconds and keeps the last 20 samples.
Memory and disk details
Two panels expand the information:
| Panel | Fields |
|---|---|
| Detalles de memoria | Total, used, free and swap (total and used) |
| Detalles de disco | Total, used, available and usage percentage |
This screen changes nothing: it only informs. If CPU, memory or disk percentages stay high over time, contact the technical or infrastructure manager.
It is useful evidence when reporting slowness or incidents: together with the Registros log, it lets you describe when it happened and the state of the server at that moment.
Next
- Activity logs: review what happened in the application.